Written by on 06/23/2017
This is the fourth article in the series of "Become a Java GC Expert". In the first issue Understanding Java Garbage Collection we have learned about the processes for different GC algorithms, about how GC works, what Young and Old Generation is, what you should know about the 5 types of GC in the new JDK 7, and what the performance implications are for each of these GC types.
In the second article How to Monitor Java Garbage Collection we have explained how JVM actually runs the Garbage Collection in the real time, how we can monitor GC, and which tools we can use to make this process faster and more effective.
In the third article How to Tune Java Garbage Collection we have shown some of the best options based on real cases as our examples that you can use for GC tuning. Also we have explained how to minimize the number of objects passed to Old Area, decreasing Full GC time, as well as how to set GC type and the memory size.
In this fourth article, I will explain the importance of MaxClients parameter in Apache that significantly affects the overall system performance when GC occurs. I will provide several examples through which you will understand the problem MaxClients value causes. I will also explain how to reliably set the proper value for MaxClients depending on the available system memory.
The effect of MaxClients on the system
The operation environment of NHN services has a variety of Throttle valve-type options. These options are important for reliable service operations. Let's see how the MaxClients option in Apache affects the system when Full GC has occurred in Tomcat.
Most developers know that "stop the world (STW) phenomenon" occurs when GC has occurred in Java (for more refer to Understanding Java Garbage Collection). In particular, Java developers at NHN may have experienced faults caused by GC-related issues in Tomcat. Because Java Virtual Machine (JVM) manages the memory, Java-based systems cannot be free of the STW phenomenon caused by GC.
Several times a day, GC occurs in services you have developed and currently operate. In this situation, even if TTS caused by faults does not occur, services may return unexpected 503 errors to users.
Service Operation Environment
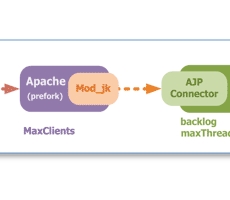
For their structural characteristics, Web services are suitable for scale-out rather than scale-up. So, generally, physical equipment is configured with Apache * 1 + Tomcat * n according to equipment performance. However, this article assumes an environment where Apache * 1 + Tomcat * 1 are installed on one host as shown in Figure 1 below for convenient description.

Figure 1: Service Operation Environment Assumed for the Article.
For reference, this article describes options in Apache 2.2.21 (prefork MPM), Tomcat 6.0.35, jdk 1.6.0_24 on CentOS 4.72 (32-bit) environment.
The total system memory is 2 GB and the Garbage Collector uses ParallelOldGC. The AdaptiveSizePolicy option is set to true by default and the heap size is set to 600m.
STW and HTTP 503
Let's assume that requests are flowing into Apache at 200 req/s and more than 10 httpd processes are running for service, even though this situation may depend on response time for requests. In this situation, assuming that the pause time at full GC is 1 second, what will happen if full GC occurs in Tomcat?
The first thing that hits your mind is that Tomcat will be paused by full GC without responding to all requests being processed. In this case, what will happen to Apache while Tomcat is paused and requests are not processed?
While Tomcat is paused, requests will continuously flow into Apache at 200 req/s. In general, before full GC occurs, responses to requests can be sent quickly by the service with only 10 or more httpd processes. However, because Tomcat is paused now, new httpd processes will continuously be created for new inflowing requests within the range allowed by the MaxClients parameter value of the httpd.conf file. As the default value is 256, it will not care that the requests are inflowing at 200 req/s.
At this time, how about the newly created httpd processes?
Httpd processes forwards requests to Tomcat by using the idle connections in the AJP connection pool managed by the mod_jk module. If there is no idle connection, it will request to create new connections. However, because Tomcat is paused, the request to create new connections will be rejected. Therefore, these requests will be queued in the backlog queue as many as the size of the backlog queue, set in the AJP Connector of the server.xml file, allows.
If the number of queued requests exceed the size of the backlog queue, a Connection is Refused error will be returned to Apache and Apache will return the HTTP 503 error to users.
In the assumed situation, the default size of backlogs is 100 and the requests are flowing in at 200 req/s. Therefore, more than 100 requests will receive the 503 error for 1 second of the pause time caused by full GC.
In this situation, if full GC is over, sockets in the backlog queue are retrieved by Tomcat's acceptance and assigned to worker threads within the range allowed by MaxThreads (defaults to 200) in order to process requests.
MaxClients and backlog
In this situation, which option should be set in order to prevent the 503 error to users?
First, we need to understand that the backlog value should be enough to accept requests flowing to Tomcat during the pause time in full GC. In other words, it should be set to at least 200 or greater.
Now, is there a problem in such configuration?
Let's repeat the above situation under the assumption that the backlog setting value has been increased to 200. This result is more serious as shown below.
The system memory usage is typically 50%. However, it rapidly increases to almost 100% when full GC occurs, causing a rapid increase of swap memory usage. Moreover, because the pause time of full GC increases from 1 second to 4 or more seconds, the system is down for that time and cannot respond to any requests.
In the first situation, only 100 or more requests received the 503 error. However, after increasing the backlog size to 200, more than 500 requests will be hung for 3 or more seconds and cannot receive responses.
This situation is a good example that shows more serious situations which may occur when you do not precisely understand the organic relations between settings, i.e., their impact on the system.
Then, why does this phenomenon occur?
The reason is the characteristics of the MaxClients option.
Setting the MaxClients value to a generous value does not matter. The most important thing in setting the MaxClients option is that the total memory usage should be calculated not to exceed 80% even though httpd processes are created as much as the maximum MaxClients value.
The swappiness value of the system is set to 60 (default). As such, when memory usage exceeds 80%, swap will actively occur.
Let's see why this characteristic causes the more serious situation described above.
When requests are flowing in at 200 req/s and Tomcat is paused by full GC, the backlog setting value is 200. Approximately, an additional 100 httpd processes can be created in Apache above the first case. In this situation, when the total memory usage exceeds 80%, the OS will actively use the swap memory area, and objects for GC will be moved from the old area of JVM to the swap area since the OS considers them unused for a long period.
Finally, when the swap area is used in GC, the pause time will rapidly increase. So, the number of httpd processes will increase, causing 100% of memory usage and the situation previously described will occur.
The difference between the two cases is only the backlog setting values: 100 vs. 200. Why did this situation occur only for 200?
The reason for the difference is the number of httpd processes created in these configurations. When the setting value is set to 100 and, full GC occurs, 100 requests for creating new connections are created and then are queued in the backlog queue. The other requests receive the connection refused error message and return the 503 error. Therefore, the number of total httpd processes will be slightly more than 100.
When the value is set to 200, then 200 requests for creating new connections can be accepted. Therefore, the number of total httpd processes will be more than 200 and the value exceeds the threshold that determines the occurrence of memory swap.
Then, by setting the MaxClients option without considering the memory usage, the number of httpd processes rapidly increases with full GC, causing swap and degradation of the system performance.
If so, how can we determine the MaxClients value, what is the threshold value for the current system situation?
Calculation Method of MaxClients Setting
As the total memory of the system is 2 GB, the MaxClients value should be set to use no more than 80% of the memory (1.6 GB) in any situation in order to prevent performance degradation caused by the memory swap. In other words, the 1.6 GB memory should be shared and allocated to Apache, Tomcat, and agent-type programs, which are installed by default.
Let's assume that the agent-type programs, which are installed in the system by default, occupy the memory at about 200 m. For Tomcat, the heap size set to -Xmx is 600m. Therefore, Tomcat will always occupy 725m (Perm Gen + Native Heap Area) based on the top RES (see the figure below). Finally, Apache can use 700m of the memory.
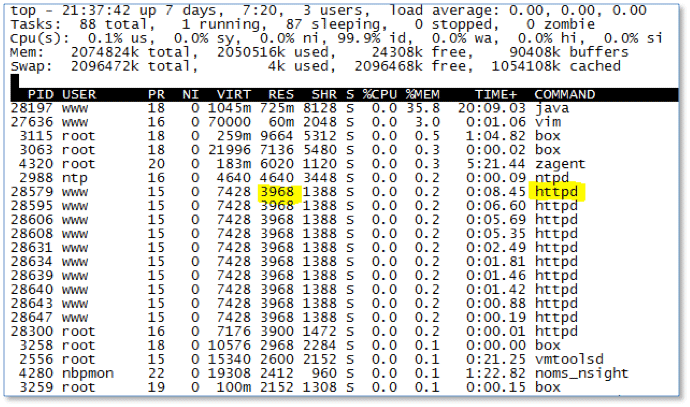
Figure 2: Top Screen of Test System.
If so, what should the value of MaxClients be with a memory of 700m?
It will be different according to the type and the number of loaded modules. However, for NHN Web services, which use Apache as a simple proxy, 4m (based on top RES) will be enough for one httpd process (see Figure 2). Therefore, the maximum MaxClients value for 700m should be 175.
Conclusion
Reliable service configuration should decrease the system downtime under overload and send successful responses to requests within the allowable range. For Java-based Web services, you must check whether the service has been configured to reliably respond to the STW under full GC.
If the MaxClients option is set to a large value, to respond to simple increase of user requests and against DDoS attacks, without considering the system memory usage, it loses its functionality as a throttle valve, causing bigger faults.
In this example, the best way to solve the problem is to expand the memory or the server, or set the MaxClients option to 175 (in the above case) so that Apache returns the 503 error to requests that only exceed 175.
The situation in this article occurs within 3 to 5 seconds, so it cannot be checked by most monitoring tools which run at regular sampling intervals.

 Understanding Vert.x Architecture - Part II
 Become a Jave GC Expert Series 5 : The Principles of Java Ap...
