The scope of this tutorial is to present some of the CUBRID built-in logging features. Please note that this tutorial will not cover the logs related to restoring committed or uncommitted transactions when a system or media (disk) error occurs and neither the logs used to support the user-specified rollback(s).
We will also show you how to use some of these logs from the CUBRID Manager client.
Overview
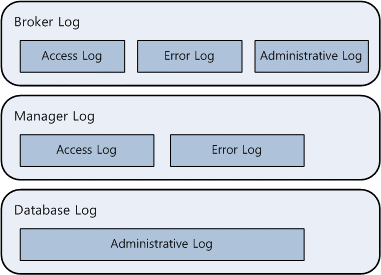
There are 3 main types of CUBRID logs, closely related to the CUBRID architecture:
- Broker logs
- CUBRID Manager logs
- Database logs
And based on the type of the operations recorded in the logs, we have separate logs for:
- Access
- Error
- Admin
This logs categorization is shown in the below image:
Let’s see now, for each log type, a brief description of what the log is intended for.
Broker Logs
- Access Log
The access log file records information about client access in a file named broker_name.access.
- Error Log
The error log file records information about the errors that occurred during the client's request processing.
- SQL Log
The SQL log file records SQL statements requested by the application client.
CUBRID Manager Logs
- Access Log
The access log files records information about the CUBRID Manager access. You can see in it user accounts, operation history, and the time when operations were performed.
- Error Log
The error log file records information about errors that occurred while connecting in the CUBRID Manager.
Database/Server Logs
- Admin Log
This admin log records information about errors that occurred while server is running.
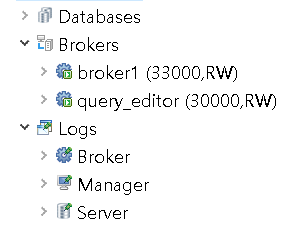
You can access all these logs from within CUBRID Manager:
Or, you can access them directly in the CUBRID installation folder:
In the next sections of this tutorial, we will go into more details regarding each log type.
Broker Logs
There are three types of logs that relate to the CUBRID Broker:
- Access log
- Error log
- SQL log
Each log can be found in the log directory under the installation directory.
You can change the directory where these logs are maintained by changing the:
- LOG_DIR
- ERROR_LOG_DIR,
parameters of the broker environment configuration file (cubrid_broker.conf).
Access Log
The access log records information about the application client and is saved with the name broker_name.access.
The default value of the parameter is off. (ACCESS_LOG)
If the LOG_BACKUP parameter is configured to ON in the Broker environment configuration file, when the Broker stops properly, the access log file is saved with the date and time when the Broker has stopped. For example, if broker1 stopped at 12:27 P.M. on June 17, 2018, an access file named broker1.access.20080617.1227 is generated in the log/broker directory.
The following is an example and description of access log file content:
1 192.168.1.203 - - 972523031.298 972523032.058 2018/06/17 12:27:46~2018/06/17 12:27:47 7118 - -1
2 192.168.1.203 - - 972523052.778 972523052.815 2018/06/17 12:27:47~2018/06/17 12:27:47 7119 ERR 1025
1 192.168.1.203 - - 972523052.778 972523052.815 2018/06/17 12:27:49~2018/06/17 12:27:49 7118 - -1
| Log Value | Explanation |
| 1 | ID assigned to the application server |
| 192.168.1.203 | IP address of the application client |
| 972523031.298 | UNIX timestamp value when the client's request processing started |
| 2018/06/17 12:46 | Time when the client's request processing started |
| 972523032.058 | Unix timestamp value when the client's request processing finished |
| 2018/06/17 12:47 | Time when the client's request processing finished |
| 7118 | Process ID of the application server |
| -1 | No error occurred during the request processing |
| ERR 1025 | Error occurred during the request processing. Error information exists in offset=1025 of the error log file |
Error Log
The error log file records information about errors that occurred during the client's request processing and is stored with the name broker_name_app_server_num.err.
The following is an example and description of error log content:
Time: 02/04/18 13:45:17.687 - SYNTAX ERROR *** ERROR CODE = -493, Tran = 1, EID = 38
Syntax: Unknown class "unknown_tbl". select * from unknown_tbl
| Time 02/04/18 13: 45:17.687 | Time when the error occurred |
| - SYNTAX ERROR | Type of error (e.g. SYNTAX ERROR, ERROR, etc.) |
| *** ERROR CODE = -493 | Error code |
| Tran = 1 | Transaction ID. -1 indicates that no transaction ID is assigned. |
| EID = 38 | Error ID. This ID is used to find the SQL log related to the server or client logs when an error occurs during SQL statement processing. |
| Syntax... |
Error message (An ellipsis ( ... ) indicates omission.) |
SQL Log
The SQL log file records SQL statements requested by the application client and are stored with the name broker_name_app_server_num.sql.log.
The SQL log is generated in the log/broker/sql_log directory when the SQL_LOG parameter is set to ON. Note that the size of the SQL log file to be generated cannot exceed the value set for the SQL_LOG_MAX_SIZE parameter.
CUBRID provides the broker_log_top, broker_log_converter, and broker_log_runner utilities to manage SQL logs.
The following is an example and description of SQL log content:
18:02:04 13:45:17.687 (38) prepare 0 insert into unique_tbl values (1)
18:02:04 13:45:17.687 (38) prepare srv_h_id 1
18:02:04 13:45:17.687 (38) execute srv_h_id 1 insert into unique_tbl values (1)
18:02:04 13:45:17.687 (38) execute error:-670 tuple 0 time 0.000, EID = 39
18:02:04 13:45:17.687 (0) auto_rollback
18:02:04 13:45:17.687 (0) auto_rollback 0
| 02/04 13: 17.687:45 | Time when the application sent the request. |
| (39) | Sequence number of the SQL statement group. If prepared statement pooling is used, it is uniquely assigned to each SQL statement in the file. |
| prepare 0 | Whether or not it is a prepared statement. |
| prepare srv_h_id 1 | Prepares the SQL statement as srv_h_id 1. |
| (PC) | It is outputted if the data in the plan cache is used. |
| SELECT... | SQL statement to be executed. (An ellipsis ( ... ) indicates omission.) For statement pooling, the binding variable of the WHERE clause is represented as a question mark (?). |
| Execute 0 tuple 1 time 0.000 | One row is executed. The time spent is 0.000 second. |
| auto_commit/auto_rollback | Automatically committed or rolled back. The second auto_commit/auto_rollback is an error code. 0 indicates that the transaction has been completed without an error. |
The broker_log_top utility analyses the SQL logs which are generated for a specific period. As a result, the information of SQL statements and time execution are outputted in files by order of the longest execution time; the results of SQL statements are stored in log.top.q and those of execution time are stored in log.top.res, respectively.
The broker_log_top utility is useful to analyze long (in terms of execution time) queries.
The syntax is:
>broker_log_top [options] sql_log_file_list
options : {-t | -F from_date | -T to_date}
Logging-Related Parameters
The following are parameters related to logs used for database backup and restore. The type and the value range for each parameter is:
| Parameter Name | Type | Default Value | Min | Max |
| log_buffer_pages | byte | 16k*log_page_size | 16k*log_page_size | 16k*log_page_size |
| log_max_archives | int | INT_MAX | 0 | INT_MAX |
| background_archiving | bool | yes | ||
| log_trace_flush_time | int | 0 | 0 | INT_MAX |
| checkpoint_interval | msec | 6min | 1min | 35,791,394min |
| checkpoint_every_size | byte | 10000*log_page_size | 10**log_page_size | log_page_size |
| adaptive_flush_control | bool | yes | ||
| max_flush_size_per_second | byte | 10000*db_page_size | 1*db_page_size | INT_MAX*db_page_size |
| sync_on_flush_size | byte | 200*db_page_size | 1*db_page_size | INT_MAX*db_page_size |
And here below is a summary presentation of each parameter meaning and usage:
| Parameter | Description |
| log_buffer_pages | log_buffer_size is a parameter to configure the size of log buffer to be cached in the memory. You can set a unit as B, K, M, G or T, which stands for bytes, kilobytes(KB), megabytes(MB), gigabytes(GB) or terabytes(TB) respectively. If you omit the unit, bytes will be applied. The default value is 16k * log_page_size (256M when log_page_size is 16K). |
| log_max_archives | log_max_archives is a parameter to configure the maximum number of archive log files. The minimum value is 0 and default value is INT_MAX (2,147,483,647). Its operations can differ depending on the configuration of force_remove_log_archives. For example, when log_max_archives is 3 and force_remove_log_archives is yes in the cubrid.conf file, the most recent three archive log files are recorded and when a fourth archiving log file is generated, the oldest archive log file is automatically deleted; the information about the deleted archive logs are recorded in the *_lginf file. |
| background_archiving | background_archiving is a parameter used to create temporary archive logs periodically at a specific time. It is useful when balancing disk I/O load which has been caused by archiving logs. The default is yes. |
| log_trace_flush_time | When the log flushing time takes more time than the time you set in this parameter, this event is recorded in the log of the database server. |
| checkpoint_interval | checkpoint_interval is a parameter to configure execution period of checkpoint. You can set a unit as ms, s, min or h, which stands for milliseconds, seconds, minutes or hours respectively. If you omit the unit, milliseconds(ms) will be applied, and it is rounded up to seconds. For example, 1ms will be 1s, and 1001ms will be 2s. The default value is 6min and the minimum value is 1min. |
| checkpoint_every_size | checkpoint_every_size is a parameter to configure checkpoint interval by log page. You can set a unit as B, K, M, G or T, which stands for bytes, kilobytes(KB), megabytes(MB), gigabytes(GB) or terabytes(TB) respectively. If you omit the unit, bytes will be applied. The default value is 10,000 * log_page_size (156.25M when log_page_size is 16K). You can distribute disk I/O overload at the checkpoint by specifying lower size in the checkpoint_every_size parameter, especially in the environment where INSERT / UPDATE are heavily loaded at a specific time. |
| adaptive_flush_control | adaptive_flush_control is a parameter used automatically to adjust the flush capacity at every 50 ms depending on the current status of the flushing operation. The default value is yes. That is, this capacity is increased if a large number of INSERT or UPDATE operations are concentrated at a certain point of time and the number of flushed pages reaches the max_flush_size_per_second parameter value; and is decreased otherwise. In the same way, you can distribute the I/O load by adjusting the flush capacity on a regular basis depending on the workload. |
| max_flush_size_per_second | max_flush_size_per_second is a parameter to configure the maximum flush capacity when the flushing operation is performed from a buffer to a disk. You can set a unit as B, K, M, G or T, which stands for bytes, kilobytes(KB), megabytes(MB), gigabytes(GB) or terabytes(TB) respectively. If you omit the unit, bytes will be applied. The default value is 10,000 * db_page_size (156.25M when db_page_size is 16K). That is, you can prevent concentration of I/O load at a certain point of time by configuring this parameter to control the maximum flush capacity per second. If a large number of INSERT or UPDATE operations are concentrated at a certain point of time, and the flush capacity reaches the maximum capacity set by this parameter, only log pages are flushed to the disk, and data pages are no longer flushed. Therefore, you must set an appropriate value for this parameter considering the workload of the service environment. |
| sync_on_flush_size | sync_on_flush_size is a parameter to configure the interval in pages between after data and log pages are flushed from buffer and before they are synchronized with FILE I/O of operating system. The default value is 200 * db_page_size (3.125M when db_page_size is 16K). That is, the CUBRID Server performs synchronization with the FILE I/O of the operating system whenever 200 pages have been flushed. This is also a parameter related to I/O load. |
Using Broker SQL Logs from CUBRID Manager Client
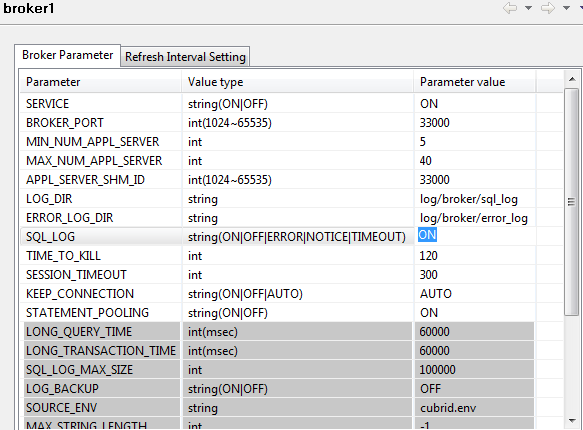
Remember: All the executed queries are stored in the log file when the SQL_LOG parameter of the Broker is ON – and you change this value easily from the CUBRID Manager client:
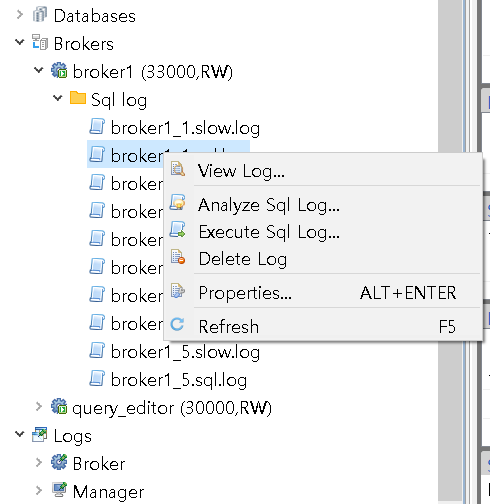
This broker log files can be viewed/analyzed/re-executed from CUBRID Manager client:
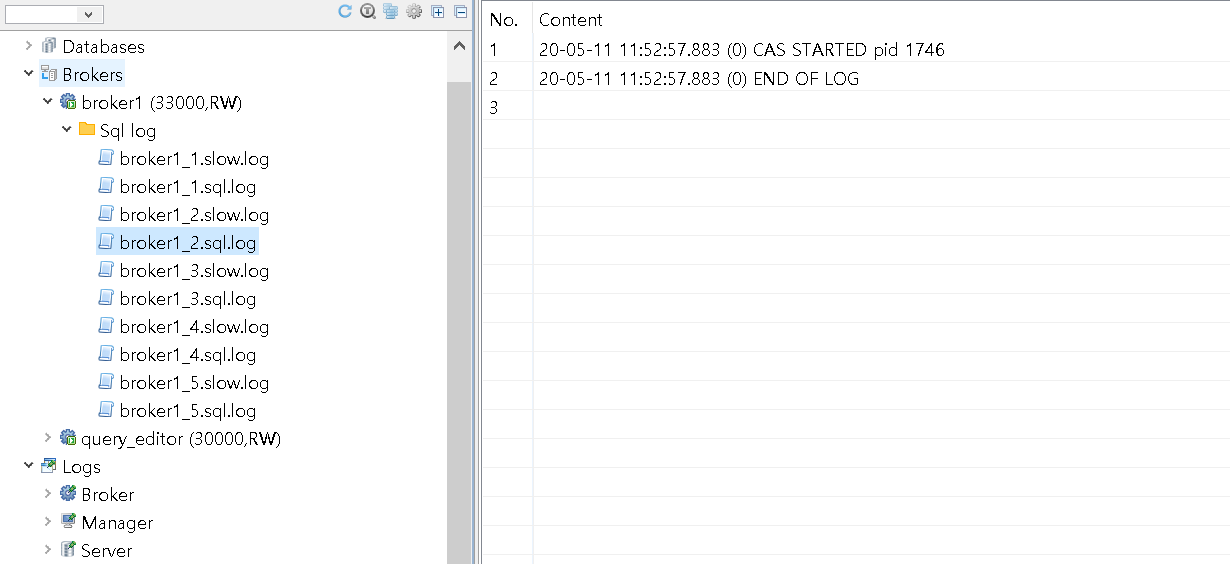
View Log
This function reads the SQL log stored in the selected file and displays 100 lines at a time. It also provides a function for selecting and copying a specific area of the log information.
Analyze Log
When Analyze Sql Log menu is selected, you can select which Broker's SQL log is to be analyzed:
- When the Transaction based analyze checkbox is selected, the log is analyzed for each transaction;
- Otherwise, they are analyzed for each query.

After selecting the SQL log file you want to analyze and then clicking OK, the results are displayed:
Execute Log
If you select Execute log, the Set Execution Information dialog box is displayed, in which you can configure the execution environment:
Log Property
By selecting the Log property menu, information about the selected log file is displayed:
Links & Resources
| Online Manual | https://www.cubrid.org/manual/en/10.2/admin/index.html |
This concludes the CUBRID Logs tutorial. Please let us know your feedback and remember to periodically check the CUBRID web site for other tutorials and resources.
Thank you!

 CUBRID Triggers
 CUBRID HA (High Availability) Starting Guide


