Written by on 06/30/2017
This is the fifth article in the series of "Become a Java GC Expert". In the first issue Understanding Java Garbage Collection we have learned about the processes for different GC algorithms, about how GC works, what Young and Old Generation is, what you should know about the 5 types of GC in the new JDK 7, and what the performance implications are for each of these GC types.
In the second article How to Monitor Java Garbage Collection we have explained how JVM actually runs the Garbage Collection in the real time, how we can monitor GC, and which tools we can use to make this process faster and more effective.
In the third article How to Tune Java Garbage Collection we have shown some of the best options based on real cases as our examples that you can use for GC tuning. Also we have explained how to minimize the number of objects passed to Old Area, decreasing Full GC time, as well as how to set GC type and the memory size.
In the fourth article MaxClients in Apache and its effect on Tomcat during Full GC we have explained the importance of MaxClients parameter in Apache that significantly affects the overall system performance when GC occurs.
In this fifth article I will explain the principles of Java application performance tuning. Specifically, I will explain what is required in order to tune the performance of Java application, the steps you need to perform to identify whether your application needs tuning. I will also explain the problems you may encounter during performance tuning. The article will be finalized with the recommendations you need to follow to make better decisions when tuning Java applications.
Overview
Not every application requires tuning. If an application performs as well as expected, you don't need to exert additional efforts to enhance its performance. However, it would be difficult to expect an application would reach its target performance as soon as it finishes debugging. This is when tuning is required. Regardless of the implementation language, tuning an application requires high expertise and concentration. Also, you may not use the same method for tuning a certain application to tune another application. This is because each application has its unique action and a different type of resource usage. For this reason, tuning an application requires more basic knowledge compared to the knowledge required to write an application. For example, you need knowledge of virtual machines, operating systems, and computer architectures. When you focus on an application domain based on such knowledge, you can successfully tune an application.
Sometimes Java application tuning requires only changing JVM options, such as Garbage Collector, but sometimes it requires changing the application source code. Whichever method you choose, you need to monitor the process of executing the Java application first. For this reason, the issues this article will deal with are as follows:
- How can I monitor a Java application?
- What JVM options should I give?
- How can I know if modifying source codes is required or not?
Knowledge Required to Tune the Performance of Java Applications
Java applications operate inside Java Virtual Machine (JVM). Therefore, to tune a Java application, you need to understand the JVM operation process. I have previously blogged about Understanding JVM Internals where you can find great insights about JVM.
The knowledge regarding the process of the operation of JVM in this article mainly refers to the knowledge of Garbage Collection (GC) and Hotspot. Although you may not be able to tune the performance of all kinds of Java applications only with the knowledge on GC or Hotspot, these two factors influence the performance of Java applications in most cases.
It is noted that from the perspective of an operating system JVM is also an application process. To make an environment in which a JVM can operate well, you should understand how an OS allocates resources to processes. This means, to tune the performance of Java applications, you should have an understanding of OS or hardware as well as JVM itself.
Another aspect is that knowledge of Java language domain is also important. It is also important to understand lock or concurrency and to be familiar with class loading or object creation.
When you carry out Java application performance tuning, you should approach it by integrating all this knowledge.
The Process of Java Application Performance Tuning
Figure 1 shows a flow chart from the book <Java Performance> co-authored by Charlie Hunt and Binu John. This chart shows the process of Java application performance tuning.
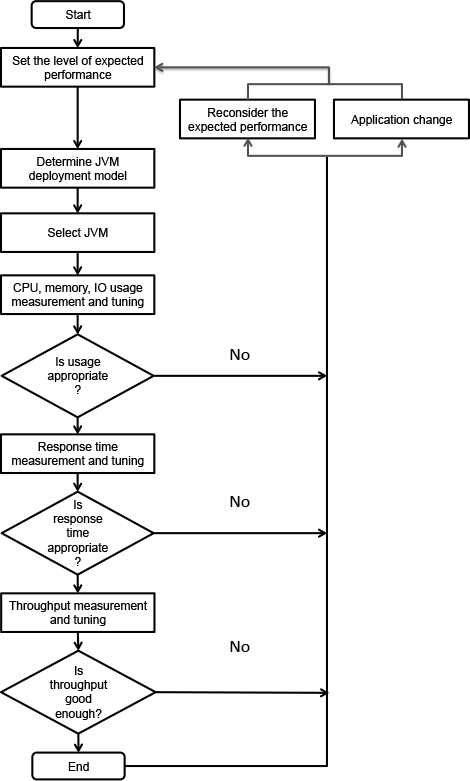
Figure 1: The Process of Tuning the Performance of Java Applications.
The above process is not a one-time process. You may need to repeat it until the tuning is completed. This also applies to determine an expected performance value. In the process of tuning, sometimes you should lower the expected performance value and sometimes raise it.
JVM distribution model
A JVM distribution model is related to making a decision on whether to operate Java applications on a single JVM or to operate them on multiple JVMs. You can decide it according to its availability, responsiveness and maintainability. When operating JVM on multiple servers, you can also decide whether to run multiple JVMs on a single server or to run a single JVM per server. For example, for each server, you can decide whether to run a single JVM using a heap of 8 GB, or to use four JVMs each using a heap of 2 GB. Of course, you can decide the number of JVMs running on a single server depending on the number of cores and the characteristics of the application. When comparing the two settings in terms of responsiveness, it might be more advantageous to use a heap of 2 GB rather than 8 GB for the same application, for it takes shorter to perform a full garbage collection when using a heap of 2 GB. If you use a heap of 8 GB, however, you can reduce the frequency of full GCs. You can also improve responsiveness by increasing the hit rate if the application uses an internal cache. Therefore, you can choose a suitable distribution model by taking into account the characteristics of the application and the method to overcome the disadvantage of the model you chose for some advantages.
JVM architecture
Selecting a JVM means whether to use a 32-bit JVM or a 64-bit JVM. Under the same conditions, you had better choose a 32-bit JVM. This is because a 32-bit JVM performs better than a 64-bit JVM. However, the maximum logical heap size of a 32-bit JVM is 4 GB. (However, actual allocatable size for both 32-bit OS and 64-bit OS is 2-3 GB.) It is appropriate to use a 64-bit JVM when a heap size larger than this is required.
| Benchmark | Time (sec) | Factor |
|---|---|---|
| C++ Opt | 23 | 1.0x |
| C++ Dbg | 197 | 8.6x |
| Java 64-bit | 134 | 5.8x |
| Java 32-bit | 290 | 12.6x |
| Java 32-bit GC* | 106 | 4.6x |
| Java 32-bit SPEC GC* | 89 | 3.7x |
| Scala | 82 | 3.6x |
| Scala low-level* | 67 | 2.9x |
| Scala low-level GC* | 58 | 2.5x |
| Go 6g | 161 | 7.0x |
| Go Pro* | 126 | 5.5x |
The next step is to run the application and to measure its performance. This process includes tuning GC, changing OS settings and modifying codes. For these tasks, you can use a system monitoring tool or a profiling tool.
It should be noted that tuning for responsiveness and tuning for throughput could be different approaches. Responsiveness will be reduced if stop-the-world occurs from time to time, for example, for a full garbage collection despite a large amount of throughput per unit time. You also need to consider that a trade-off could occur. Such trade-off could occur not only between responsiveness and throughput. You may need to use more CPU resources to reduce memory usage or put up with reduction in responsiveness or throughput. As opposite cases could likewise occur, you need to approach it according to the priority.
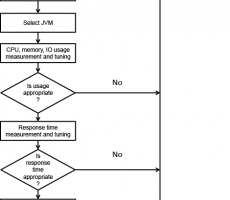
The flow chart of Figure 1 above shows the performance tuning approach for almost all kinds of Java applications, including Swing applications. However, this chart is somewhat unsuitable for writing a server application for Internet service as our company NHN does. The flow chart in Figure 2 below is a simpler procedure designed based on Figure 1 to be more suitable for NHN.

Figure 2: A Recommended Procedure for Tuning NHN's Java Applications.
Select JVM in the above flow chart means using a 32-bit JVM as much as possible except when you need to use a 64-bit JVM to maintain cache of several GB.
Now, based on the flow chart in Figure 2, you will learn about things to do to execute each of the steps.q
JVM Options
I will explain how to specify suitable JVM options mainly for a web application server. Despite not being applied to every case, the best GC algorithm, especially for web server applications, is the Concurrent Mark Sweep GC. This is because what matters is low latency. Of course, when using the Concurrent Mark Sweep, sometimes a very long stop-the-world phenomenon could take place due to fractions. Nevertheless, this problem is likely to be resolved by adjusting the new area size or the fraction ratio.
Specifying the new area size is as important as specifying the entire heap size. You had better specify the ratio of the new area size to the entire heap size by using –XX:NewRatio or specify the desired new area size by using the –XX:NewSize option. Specifying a new area size is important because most objects cannot survive long. In web applications, most objects, except cache data, are generated when HttpResponse to HttpRequest is created. This time hardly exceeds a second. This means the life of objects does not exceed a second, either. If the new area size is not large, it should be moved to the old area to make space for newly created objects. The cost for GC for the old area is much bigger than that for the new area; therefore, it is good to set the size of the new area sufficiently.
If the new area size exceeds a certain level, however, responsiveness will be reduced. This is because the garbage collection for the new area is basically to copy data from one survivor area to another survivor area. Also, the stop-the-world phenomenon will occur even when performing GC for the new area as well as the old area. If the new area becomes bigger, the survivor area size will increase, and thus the size of the data to copy will increase as well. Given such characteristics, it is good to set a suitable new area size by referring to the NewRatio of HotSpot JVM by OS.
| OS and option | Default -XX:NewRatio |
|---|---|
| Sparc -server | 2 |
| Sparc -client | 8 |
| x86 -server | 8 |
| x86 -client | 12 |
If the NewRatio is specified, 1/(NewRatio +1) of the entire heap size becomes the new area size. You will find the NewRatio of Sparc -server is very small. This is because the Sparc system was used for more high-end use than x86 when default values were specified. Now it is common to use the x86 server and its performance has also been improved. Thus it is better to specify 2 or 3, which is the value similar to that of the Sparc -server.
You can also specify NewSize and MaxNewSize instead of NewRatio. The new area is created as much as the value specified for NewSize and the size increments as much as the value specified for MaxNewSize. The Eden or Survivor area also increases according to the (specified or default) ratio. As you specify the same size for -Xs and -Xmx, it is a very good choice to specify the same size for MaxSize and MaxNewSize.
If you have specified both NewRatio and NewSize, you should use the bigger one. Therefore, when a heap has been created, you can express the initial New area size as follows:
|
1
|
min(MaxNewSize, max(NewSize, heap/(NewRatio+1))) |
However, it is impossible to determine the appropriate entire heap size and New area size in a single attempt. Based on my experience running Web server applications at NHN, I recommend to run Java applications with the following JVM options. After monitoring the performance of the application with these options, you can use a more suitable GC algorithm or options.
| Type | Option |
|---|---|
| Operation mode | -sever |
| Entire heap size | Specify the same value for -Xms and -Xmx. |
| New area size | -XX:NewRatio: value of 2 to 4 |
-XX:NewSize=? –XX:MaxNewSize=?. Also good to specify NewSize instead of NewRatio. |
|
| Perm size | -XX:PermSize=256 m -XX:MaxPermSize=256 m. Specify the value to an extent not to cause any trouble in the operation because it does not affect the performance. |
| GC log | -Xloggc:$CATALINA_BASE/logs/gc.log -XX:+PrintGCDetails -XX:+PrintGCDateStamps. Leaving a GC log does not particularly affect the performance of Java applications. You are recommended to leave a GC log as much as possible. |
| GC algorithm | -XX:+UseParNewGC -XX:+CMSParallelRemarkEnabled -XX:+UseConcMarkSweepGC -XX:CMSInitiatingOccupancyFraction=75.This is only a generally recommendable configuration. Other choices could be better depending on the characteristics of the application. |
| Creating a heap dump when an OOM error occurs | -XX:+HeapDumpOnOutOfMemoryError -XX:HeapDumpPath=$CATALINA_BASE/logs |
| Actions after an OOM occurs | -XX:OnOutOfMemoryError=$CATALINA_HOME/bin/stop.sh or -XX:OnOutOfMemoryError=$CATALINA_HOME/bin/restart.sh. After leaving a heap dump, take a proper operation according to a management policy. |
Measuring the Performance of Applications
The information to acquire to grasp the performance of an application is as follows:
- TPS (OPS): The information required to understand the performance of an application conceptually.
- Request Per Second (RPS): Strictly speaking, RPS is different from responsiveness, but you can understand it as responsiveness. Through RPS, you can check the time it takes for the user to see the result.
- RPS Standard Deviation: It is necessary to induce even RPS if possible. If a deviation occurs, you need to check GC tuning or interworking systems.
To obtain a more accurate performance result, you should measure it after warming up the application sufficiently. This is because byte code is expected to be compiled by HotSpot JIT. In general, you can measure actual performance values after applying load to a certain feature for at least 10 minutes by using nGrinder load testing tool.
Tuning in Earnest
You don't need to tune the performance of an application if the result of the execution of nGrinder meets the expectation. If the performance does not meet the expectation, you need to carry out tuning to resolve problems. Now you will see the approach by case.
In the event the Stop-the-World takes long
Long stop-the-world time could result from inappropriate GC options or incorrect implementation. You can decide the cause according to the result of a profiler or a heap dump. This means you can judge the cause after checking the type and number of objects of a heap. If you find many unnecessary objects, you had better modify source codes. If you find no particular problem in the process of creating objects, you had better simply change GC options.
To adjust GC options appropriately, you need to have GC log secured for a sufficient period of time. You need to understand in which situation the stop-the-world takes a long time. For more information on the selection of appropriate GC options, read my colleague's blog about How to Monitor Java Garbage Collection.
In the event CPU usage rate is low
When blocking time occurs, both TPS and CPU usage rate will decrease. This might result from the problem of interworking systems or concurrency. To analyze this, you can use an analysis on the result of thread dump or a profiler.
You can conduct a very accurate lock analysis by using a commercial profiler. In most cases, however, you can obtain a satisfactory result with only the CPU analyzer in jvisualvm.
In the event CPU usage rate is high
If TPS is low but CPU usage rate is high, this is likely to result from inefficient implementation. In this case, you should find out the location of bottlenecks by using a profiler. You can analyze this by using jvisuavm, TPTP of Eclipse or JProbe.
Approach for Tuning
You are advised to use the following approach to tune applications.
First, you should check whether performance tuning is necessary. The process of performance measuring is not easy work. You are also not guaranteed to obtain a satisfactory result all the time. Therefore, if the application already meets its target performance, you don't need to invest additionally in performance.
The problem lies in only a single place. All you have to do is to fix it. The Pareto principle applies to performance tuning as well. This does not mean to emphasize that the low performance of a certain feature results necessarily from a single problem. Rather, this emphasizes that we should focus on one factor that has the biggest influence on the performance when approaching performance tuning. Thus, you could handle another problem after fixing the most important one. You are advised to try to fix just one problem at a time.
You should consider the balloon effect. You should decide what to give up to get something. You can improve responsiveness by applying cache but if the cache size increases, the time it takes to carry out a full GC will increase as well. In general, if you want a small amount of memory usage, throughput or responsiveness could be deteriorated. Thus, you need to consider what is most important and what is less important.
So far, you have read the method for Java application performance tuning. To introduce a concrete procedure for performance measurement, I had to omit some details. Nevertheless, I think this could satisfy most of the cases for tuning Java web server applications.
Good luck with performance tuning!

 CUBRID DBLink
